
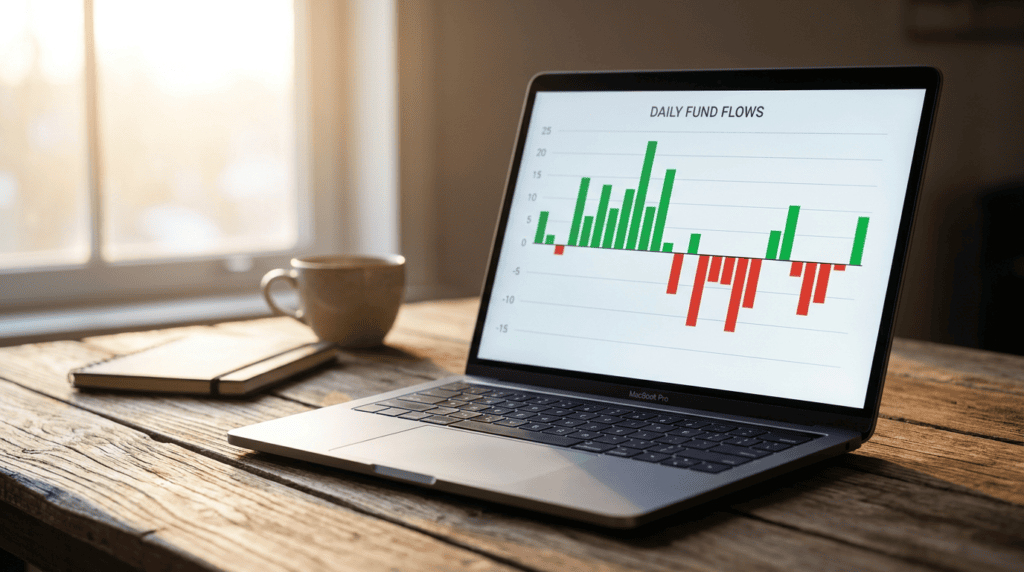
Ethereum ETF news today almost always comes down to one number: net flow, the dollar value of fund shares created minus shares redeemed on the last US trading day. A negative figure means more shares came out than went in. It does not mean anyone dumped ETH on an exchange.
Below you will find where the daily figures are published, what one day can and cannot tell you, and a quick check that stops you from reading a red print as a verdict.
Where the daily Ethereum ETF flow numbers come from
Flow starts with authorized participants, the firms that hand ETH or cash to a fund in exchange for new shares, or return shares to get assets back. Net flow is creations minus redemptions. Why the fund needs a regulated holder of that ETH is covered in what crypto custody actually means for ETFs.
Farside Investors publishes the daily table in US$ millions, one column per fund (ETHA, FETH, ETHE and the rest), with negatives in parentheses. Farside states that the table is generated automatically and that it is not liable for errors, so treat it as a tracker, not an audit.
The primary source is the issuer. BlackRock’s iShares page for ETHA lists shares outstanding (154,973,284 as of October 9, 2026) and net assets ($8,694,021,706 on the same date). A change in shares outstanding is the raw material behind any flow figure.
Video: ETFcom
What one day’s number can and cannot tell you
It cannot tell you how much trading happened. On October 8, 2026, ETHA traded 28,888,491 shares around a $55.70 close, roughly $1.6 billion of shares by my arithmetic. Farside’s flow for ETHA that day was an outflow of $71.1 million.
Most of that volume was investors swapping shares with each other, which never touches flow. Only creations and redemptions do.
It also cannot tell you why. A fund manager rebalancing and a trader unwinding a hedge produce the same red number as a holder who gave up on ETH.
NewsBTC made the same point about the $201.9 million outflow on October 6: large creations and redemptions happen for rebalancing and short-term trading reasons. For the price side of that argument, see why inflows do not always mean higher prices.
Why one day of outflows is noise: fifteen trading days of data
| Date | ETHA (BlackRock) | All funds |
|---|---|---|
| Sep 30 | 0.0 | (59.6) |
| Oct 1 | 0.0 | (55.4) |
| Oct 2 | (20.1) | (37.4) |
| Oct 5 | (31.9) | (50.8) |
| Oct 6 | (201.9) | (201.9) |
| Oct 7 | (116.1) | (160.9) |
| Oct 8 | (71.1) | (72.5) |
| Oct 9 | (56.1) | (56.1) |
Source: Farside Investors, farside.co.uk/eth, read October 10, 2026. Parentheses mean outflow.
Those eight straight outflow days add up to $694.6 million, and the headlines wrote themselves. On October 6 the entire outflow came from ETHA, while Farside shows 0.0 for every other fund.
Now widen the window. The five days from September 21 to 25 took in $689.8 million. Add September 28 (+17.1) and 29 (-2.8) and all 15 trading days from September 21 to October 9 net to roughly +$9.5 million, my sum of Farside’s totals.
The streak was real. It was also a near-complete reversal of the week before it, which is a very different story from “institutions are fleeing.”
A four-step check before you trust a flow headline
- Find which fund moved. One issuer carrying the whole number points to one holder’s decision.
- Sum at least ten trading days, not one.
- Check the seed. Farside notes that ETHE and ETH carry seed balances converted from prior products, so cumulative totals are not all fresh money.
- Compare with the Bitcoin side, as in spot Bitcoin ETF inflows and outflows, before calling anything a trend.
My opinion: a single day of flow data is a thermometer reading, not a diagnosis. Anyone selling a price call off one print is selling the headline, not the data.
Does an ETF outflow mean ETH is being sold?
Not directly. A redemption returns shares to the fund, which then delivers ETH or cash to the authorized participant. What that participant does next is not in the flow number.
Where can I see daily Ethereum ETF flows?
Farside Investors publishes a daily table by fund at farside.co.uk/eth. For a single fund, the issuer’s own page, such as iShares for ETHA, shows shares outstanding and net assets.
How many days of flow data should I look at?
No official rule exists. I use at least ten trading days, because one week of outflows can fully offset the week before it, as the September and October figures above show.

Charles Benkovich is the Crypto Editor at Hold Hub. He covers Bitcoin, Ethereum, XRP, and macro-driven market analysis with a focus on on-chain data over price speculation. His editorial standard: claims are sourced or labeled as analysis, and the site takes no payment to cover any project.